Mandelbrot Set #
Introduction #
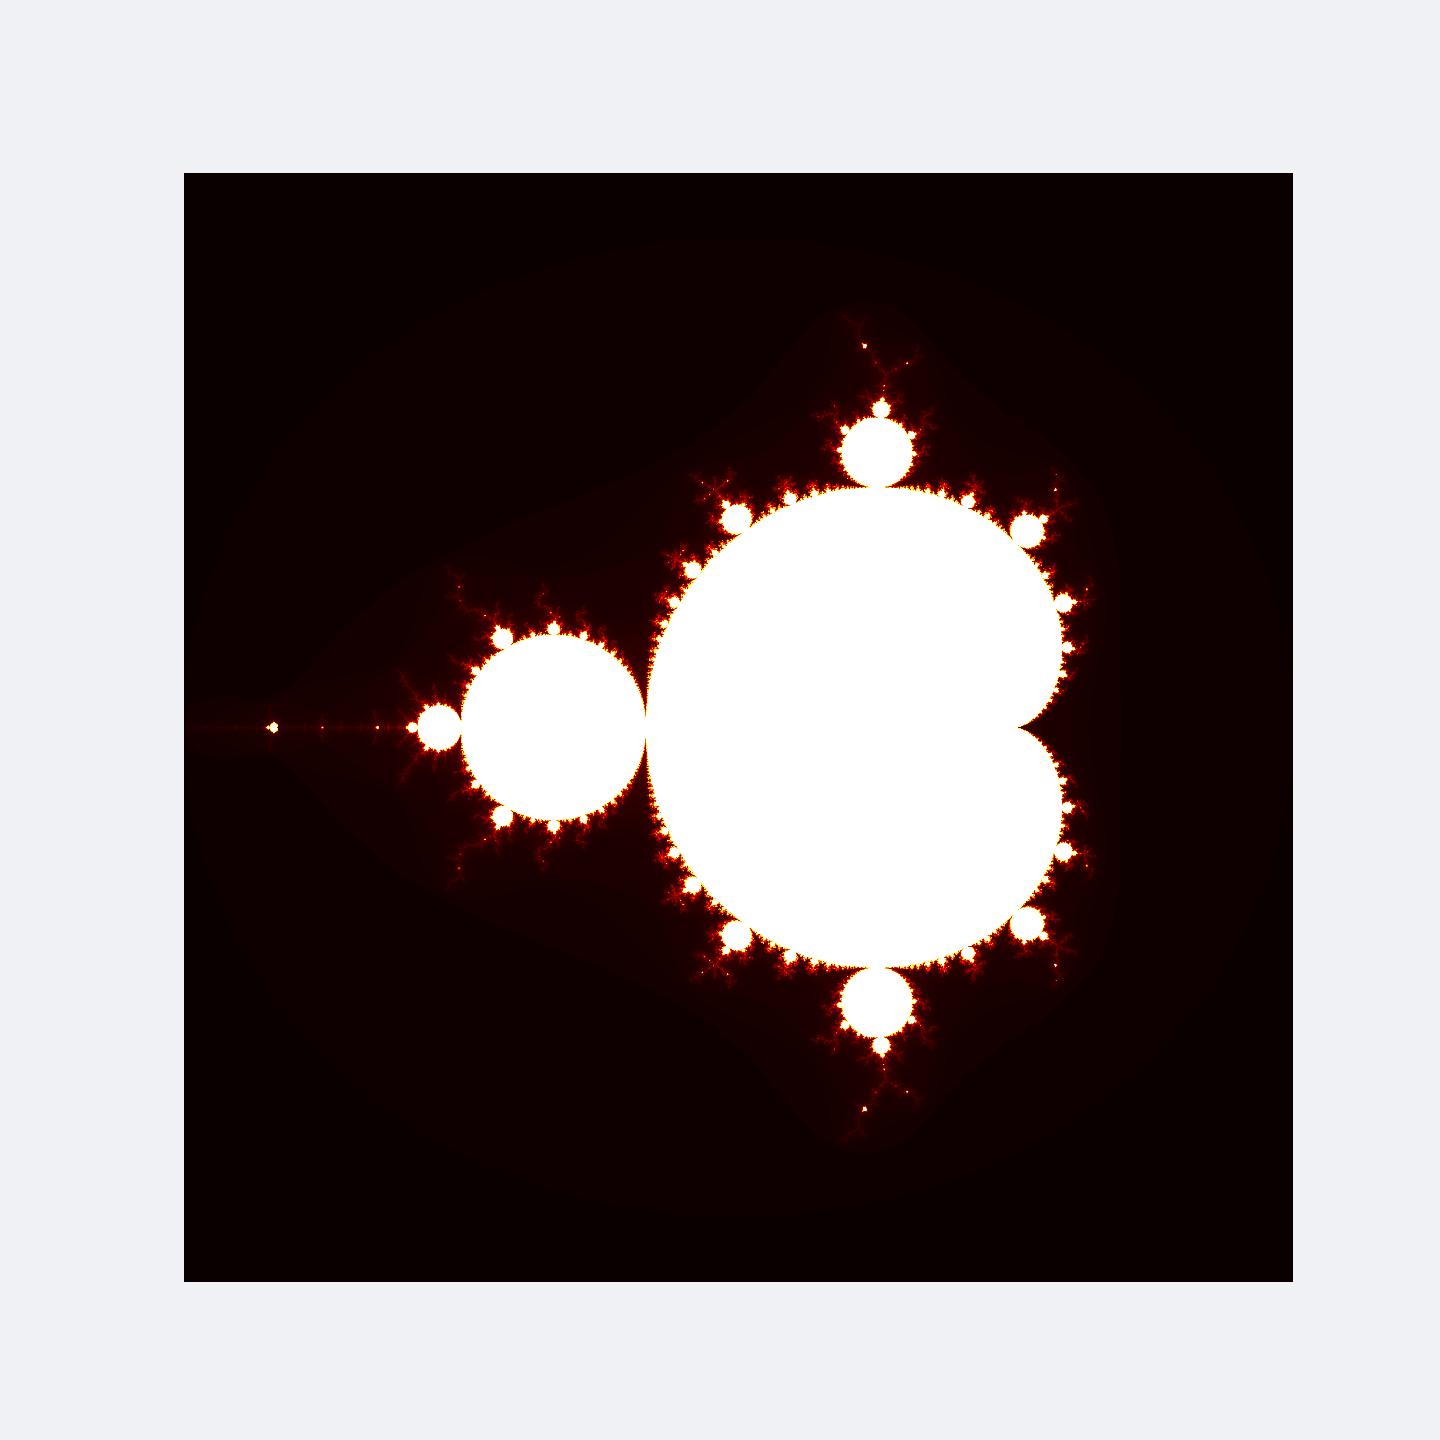
The Mandelbrot set is a fascinating concept in the field of complex dynamics, a branch of mathematics. It is a two-dimensional set defined in the complex plane, known for its intricate and infinitely recursive boundary that exhibits fractal properties. The set is defined by a relatively simple iterative equation, $z_{n+1} = z_{n}^2 + c$ where $c$ is a complex number and the sequence starts with $z_0 = 0$
The Mandelbrot set includes all complex numbers, $c$, for which this sequence does not diverge to infinity, meaning it remains bounded in absolute value. This set was first defined and drawn by Robert W. Brooks and Peter Matelski in 1978, and later visualized by Benoit Mandelbrot in 1980.
Here is a numpy version.
import numpy as np
import matplotlib.pyplot as plt

# Function to calculate Mandelbrot fractal
def mandelbrot(c, max_iter):
    z = c
    # Iterate until the absolute value of z exceeds 2 or maximum iterations reached
    for n in range(max_iter):
        if abs(z) > 2:
            return n
        z = z*z + c
    return max_iter

# Function to draw Mandelbrot fractal
def draw_mandelbrot(xmin,xmax,ymin,ymax,width,height,max_iter):
    # Create linearly spaced points between xmin and xmax, ymin and ymax
    r1 = np.linspace(xmin, xmax, width)
    r2 = np.linspace(ymin, ymax, height)
    # Return a 2D array of Mandelbrot fractal values
    return (r1,r2,np.array([[mandelbrot(complex(r, i),max_iter) for r in r1] for i in r2]))

# Main function
def main():
    # Define parameters for the image
    dpi = 300
    img_width = 1440
    img_height = 1440
    xmin = -2.0
    xmax = 1.0
    ymin = -1.5
    ymax = 1.5
    max_iter = 256

    # Generate Mandelbrot fractal
    x,y,z = draw_mandelbrot(xmin,xmax,ymin,ymax,img_width,img_height,max_iter)

    # Create a new figure with the specified size and resolution
    fig, ax = plt.subplots(figsize=(img_width/dpi, img_height/dpi),dpi=dpi)
    # Display the image
    ax.imshow(z, origin='lower', cmap='hot')
    # Hide axes
    ax.axis('off')
    # Save the figure
    plt.savefig("mandelbrot-1.png", dpi=300)
    # Display the figure
    plt.show()

# Call the main function
if __name__ == "__main__":
    main()
and here is the PyTorch version:

import torch
import matplotlib.pyplot as plt

def mandelbrot(c, max_iter):
    z = c.clone()  # Creates a copy of the input tensor 'c'.
    for t in range(max_iter):  # Iterates up to a maximum number of iterations.
        mask = torch.abs(z) < 1000  # Creates a boolean mask where the condition holds.
        z[mask] = z[mask] ** 2 + c[mask]  # Applies the Mandelbrot function to elements where the mask is True.
    return z  # Returns the final tensor after all iterations.

def draw_mandelbrot(xmin,xmax,ymin,ymax,width,height,max_iter):
    # Creates a 1-D tensor of evenly spaced points between xmin and xmax.
    x = torch.linspace(xmin, xmax, width).cpu()
    # Creates a 1-D tensor of evenly spaced points between ymin and ymax.
    y = torch.linspace(ymin, ymax, height).cpu()
    # Generates coordinate grids from the input vectors x and y.
    X, Y = torch.meshgrid(x, y)
    # Forms a complex tensor from the coordinate grids.
    c = X + Y * 1j
    # Calls the mandelbrot function with the complex tensor and maximum iterations.
    z = mandelbrot(c, max_iter)
    # Plots the absolute value of the tensor 'z'.
    plt.imshow(torch.abs(z.cpu()), cmap='twilight_shifted', extent=(xmin, xmax, ymin, ymax))
    # Turns off the axis.
    plt.axis('off')
    # Saves the figure as a .png file with a resolution of 300 dots per inch.
    plt.savefig("mandelbrot-2.png", dpi=300)
    # Displays the figure.
    plt.show()

def main():
    draw_mandelbrot(-2.0, 1.0, -1.5, 1.5, 1440, 1440, 256)

if __name__ == "__main__":
    main()